User guide for executing `CytOpT` on `HIPC` data
Paul Freulon, Jérémie Bigot, Kalidou BA, Boris Hejblum
2025-04-04
Source:vignettes/CytOpt_HIPC.Rmd
CytOpt_HIPC.RmdIntroduction
CytOpT is a supervised method that directly estimates
the cell proportions in a flow-cytometry data set by using a source
gating as its input and relies on regularized optimal transport.
Analysis of HIPC data
As an illustrative example, we analyze here the flow cytometry data from the T-cell panel of the Human Immunology Project Consortium (HIPC) publicly available on ImmuneSpace Gottardo et al. [2014].
An HIPC data set has the following structure (split into
2 files):
-
xx_y_values: flow-cytometry measurements -
xx_y_clust: file with the corresponding manual clustering
Above, xx denotes the center where the data analysis was
performed, and y denotes the patient and the replicate of
the biological sample in question.
Data load
Here are the first few lines of the flow-cytometry measurements from patient 1228 replicate 1A:
| CCR7 | CD4 | CD45RA | CD3 | HLADR | CD38 | CD8 |
|---|---|---|---|---|---|---|
| 717.3339 | 1146.5768 | 3094.811 | 2526.265 | 1333.1118 | 1510.164 | 3203.711 |
| 681.8582 | 1398.1466 | 3168.901 | 2394.297 | 918.4464 | 1306.356 | 3056.621 |
| 402.3024 | 920.2601 | 3440.265 | 2221.533 | 1585.4507 | 1086.020 | 2728.252 |
| 1509.6527 | 1492.2483 | 3143.388 | 2592.564 | 1116.4272 | 1577.515 | 3191.382 |
| 1365.9507 | 659.6762 | 3382.406 | 2126.847 | 1317.9880 | 1277.266 | 3079.729 |
| 1388.9562 | 1213.0846 | 3486.772 | 2450.046 | 1103.4678 | 1474.890 | 3200.576 |
The manual clustering of these data into 10 cell populations (CD8
Effector, CD8 Naive, CD8 Central Memory, CD8 Effector Memory, CD8
Activated, CD4 Effector, CD4 Naive, CD4 Central Memory, CD4 Effector
Memory, CD4 Activated) can be accessed from the
HIPC_Stanford_1228_1A_labels object.
We will use the manual gating from patient 1228 replicate 1A as our source proportions to infer proportions for patient 1369 replicate 1A.
Computation of the benchmark class proportions for target data
Because in this example, we know the true proportions in the target
data set HIPC_Stanford_1369_1A, we can assess the gap
between the estimate form CytOpt and the cellular
proportions from the reference manual gating. For this purpose, we
compute those manual proportions with:
CytOpT
Optimization
set.seed(123)
res <- CytOpT(X_s = HIPC_Stanford_1228_1A, X_t = HIPC_Stanford_1369_1A,
              Lab_source = HIPC_Stanford_1228_1A_labels,
              theta_true = gold_standard_manual_prop,
              method="minmax", monitoring = TRUE)
#> Converting `X_s` from data.frame to matrix type
#> Converting `X_t` from data.frame to matrix type
#> Running MinMax optimization...
#> Done in 14.9 secs
Results
The results from CytOpt for both optimization algorithms
are:
summary(res)
#> Estimation of cell proportions with MinMax swapping from CytOpt:
#>                     Gold_standard       MinMax
#> CD8 Effector          0.017004001 0.0460721887
#> CD8 Naive             0.128736173 0.0986954400
#> CD8 Central Memory    0.048481996 0.0353207988
#> CD8 Effector Memory   0.057484114 0.0739104028
#> CD8 Activated         0.009090374 0.0114376295
#> CD4 Effector          0.002324076 0.0003365706
#> CD4 Naive             0.331460344 0.3499192716
#> CD4 Central Memory    0.281713344 0.2062427054
#> CD4 Effector Memory   0.102082843 0.1757554116
#> CD4 Activated         0.021622735 0.0023095809
#>
#> Final Kullback-Leibler divergences:
#> MinMax swapping
#>      0.07403724
#> Number of iterations:
#> MinMax swapping
#>           10000
Some visualizations are provided by the plot()
method:
plot(res)
#> Plotting KL divergence for iterations 10 to 1000 while there were at least 10000 iterations performed for each method.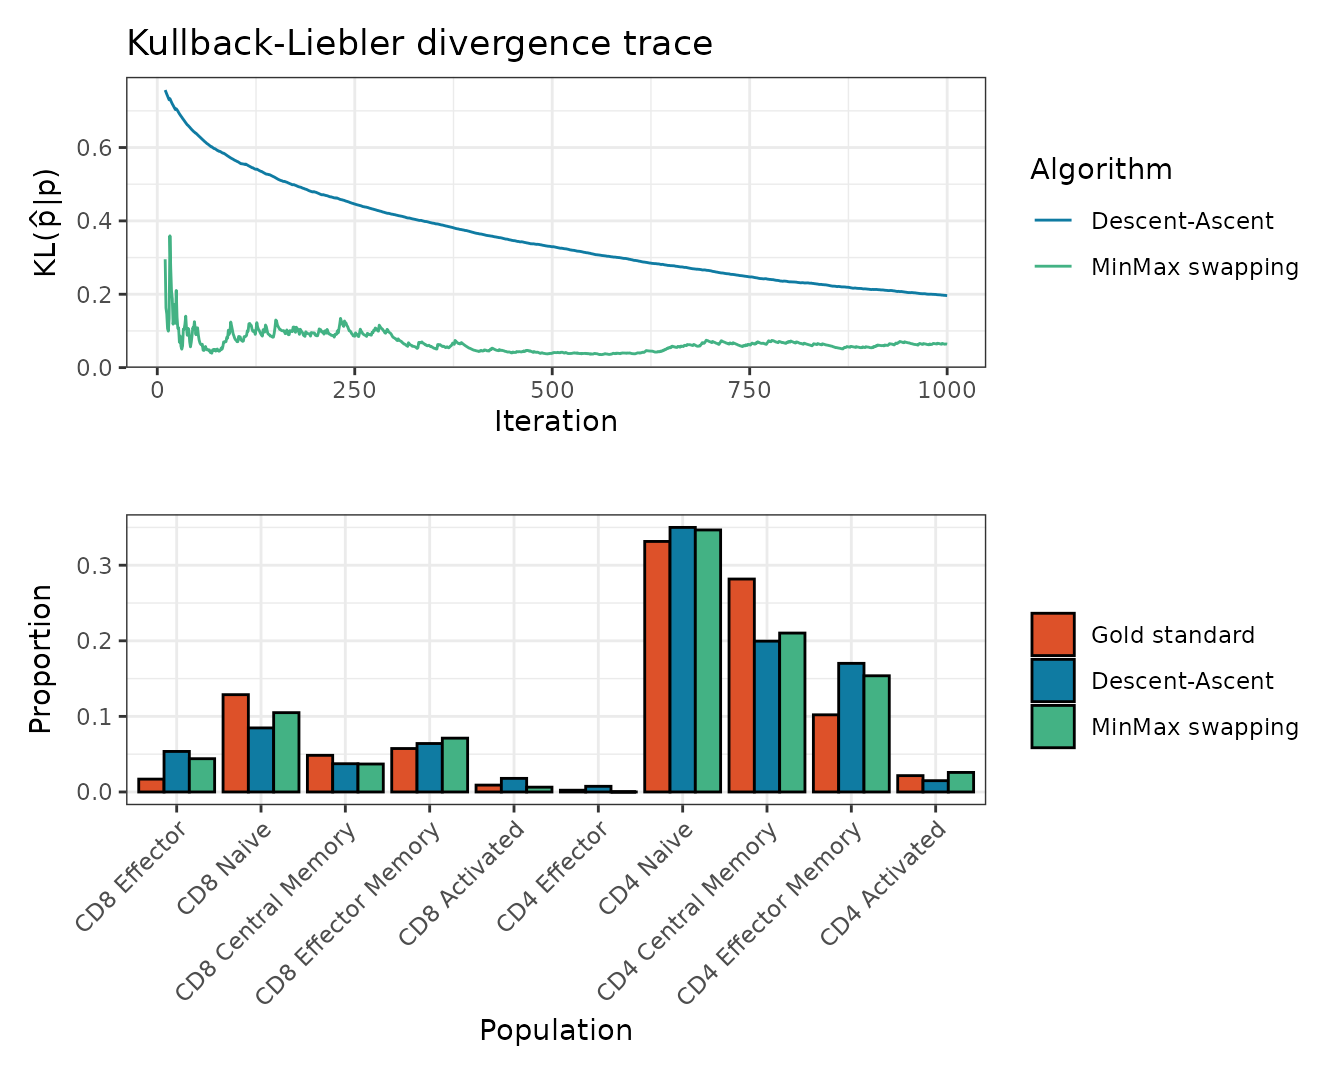
Performance evaluation
Concordance between the manual gating gold-standard and
CytOpt estimation can be graphically diagnosed with
Bland-Altman plots:
Bland_Altman(res$proportions)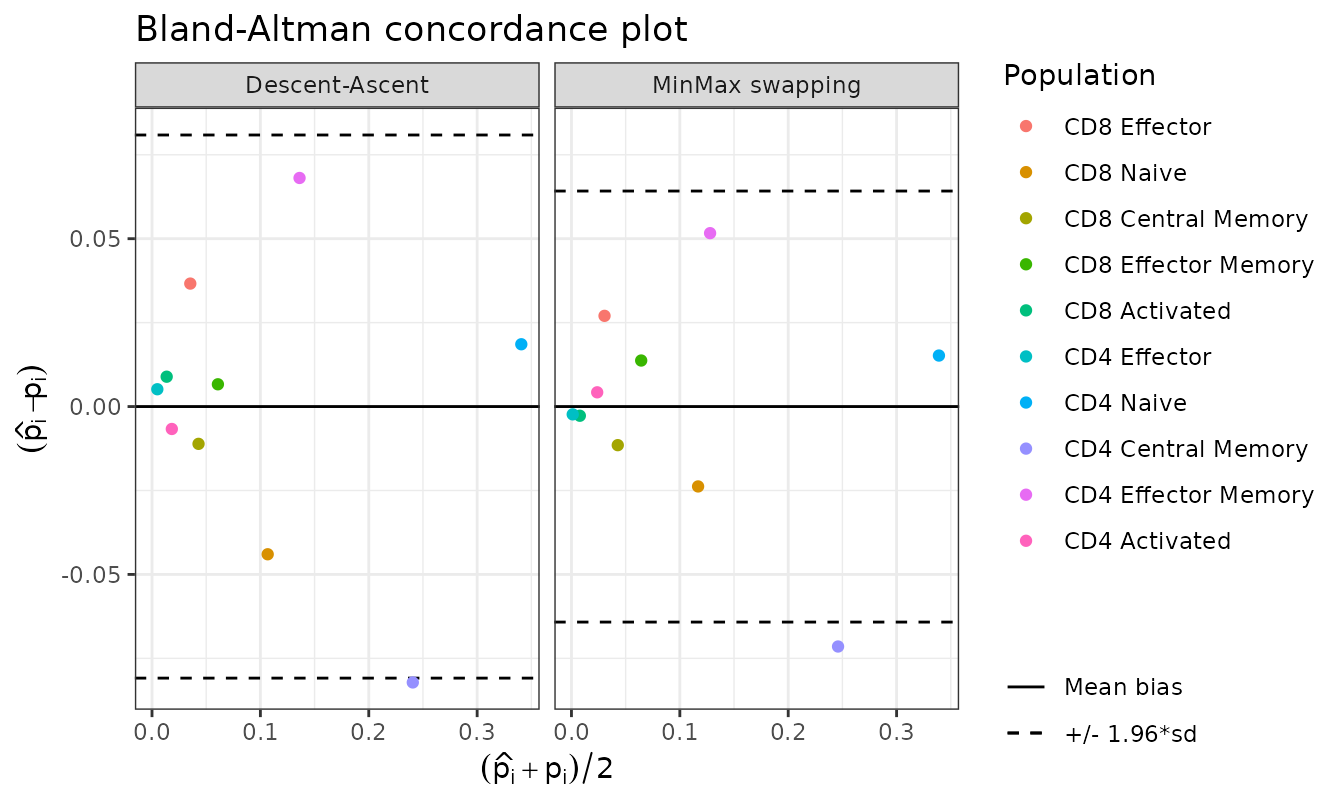
The methods implemented in the CytOpt package are
detailed in the following article:
Paul Freulon, Jérémie Bigot, Boris P. Hejblum. CytOpT: Optimal Transport with Domain Adaptation for Interpreting Flow Cytometry data Annals of Applied Statistics, 17(2), 1086-1104. doi:10.1214/22-AOAS1660 https://doi.org/10.1214/22-AOAS1660 https://arxiv.org/abs/2006.09003