
Test the conditional independence of Y and X given Z.
Arguments
- Y
a numeric vector of length
nto test for conditional independence withXadjusted onZ- X
a data frame of size
n x pof numeric or factor vector(s) containing the variable(s) to be tested for conditional independence againstXadjusted onZ.- Z
a data frame of size
n x qof numeric or factor vector(s) containing the covariate(s) to condition the independence test upon.- space_y
a logical flag indicating whether the y thresholds are spaced. When
space_yisTRUE, a regular sequence between the minimum and the maximum of the observations is used. Default isFALSE.- number_y
an integer value indicating the number of y thresholds (and therefore the number of regressions) to perform the test. Only used if
space_yisTRUE. Default is10.- design
an optional (and technical) list of design quantities, as returned by the internal
.cit_design(X, Z, n). This is used bycit_multi(), to loop-call over many genes while building the model matrix, and computing its cross-product and its inverse only once. Default isNULL, in which case they are computed fromXandZ. Users should not be using this argument- variance
a character string, the estimator of the covariance of the OLS coefficients of
Xthat gives the weights of the asymptotic \(\chi^2\) mixture. Either"sandwich"(default) use the heteroskedasticity-robust sandwich estimator, valid with or without
Z."independent"the factorized estimator only valid only when
Zis NULLYandZare independent ; too conservative whenZactually affectsY.
- residuals
a character string indicating which residuals are used in the sandwich estimator (ignored when
variance = "independent"). Either"full"(default) residuals of the linear model including
X(Wald-type). Consistent for the variance of theXcoefficients under the null hypothesis and under the alternative."restricted"residuals of the null model without
X(score-type). Consistent under the null hypothesis only: under the alternative the effect ofXis counted as noise, which can decrease power. Somewhat better calibrated than"full"in some small samples settings but very conservative with unbalanced levels of a factor fromX. Not recommended as primary analysis, but can serve as a conservative sensitivity analysis.
- small_sample_corr
a character string indicating the small-sample correction of the sandwich estimator to be used (ignored when
variance = "independent"). OLS residuals underestimate the errors, which makes the asymptotic test anti-conservative whennis small relative tod(i.e. small samples or many covariates), the number of coefficients of the model that appear in the residual computations. Can be ither:"HC2"(default)each residual is divided by \(\sqrt{1 - h_i}\), where the leverage \(h_i = W_i^\top (W^\top W)^{-1} W_i\) measures how much observation \(i\) pulls the fit towards itself (\(W\) being the design matrix of
XandZ, with intercept). In the case of a leverage of 1, the"HC1"correction is used instead for that residual (and a warning is issued)."HC1"uniform correction where the estimator is multiplied by
n/(n-d)."none"no correction
(Long & Ervin, 2000). A warning is issued when
n < 30or a level of a factor fromXhas fewer than 10 observations (the asymptotic test can then remain anti-conservative).Default is
"HC2".
Value
A data frame with the following elements:
raw_pvalcontains the raw p-values for a given gene.test_statisticcontains the test statistic for a given gene.
Details
The space_y / number_y grid controls both the
resolution of the statistic and its computational cost. See
cit_multi for details on this trade-off.
References
Gauthier M, Agniel D, Thiébaut R & Hejblum BP (2021). Distribution-free complex hypothesis testing for single-cell RNA-seq differential expression analysis, bioRxiv 445165. doi:10.1101/2021.05.21.445165 .
Long JS & Ervin LH (2000). Using heteroscedasticity consistent standard errors in the linear regression model, The American Statistician 54(3):217-224. doi:10.1080/00031305.2000.10474549 .
Examples
set.seed(123)
X <- as.factor(rbinom(n = 100, size = 1, prob = 0.5))
Y <- ((X == 1) * rnorm(n = 100, 0, 1)) + ((X == 0) * rnorm(n = 100, 0.5, 1))
res_asymp <- cit_asymp(Y, data.frame(X = X))
Z <- as.factor(rbinom(n = 100, size = 1, prob = 0.5))
X <- as.numeric(Z) - 1 + rnorm(n = 100, sd = 1)
r <- 500
Y <- replicate(r, as.numeric(Z) - 1)
YY <- (Y == 1) * rnorm(n = 100 * r, 0, 1) + (Y == 0) * rnorm(n = 100 * r, 0.5, 1)
pvals_sim <- sapply(seq_len(r), function(i) {
cit_asymp(YY[, i], data.frame(X = X), data.frame(Z = Z))$raw_pval
})
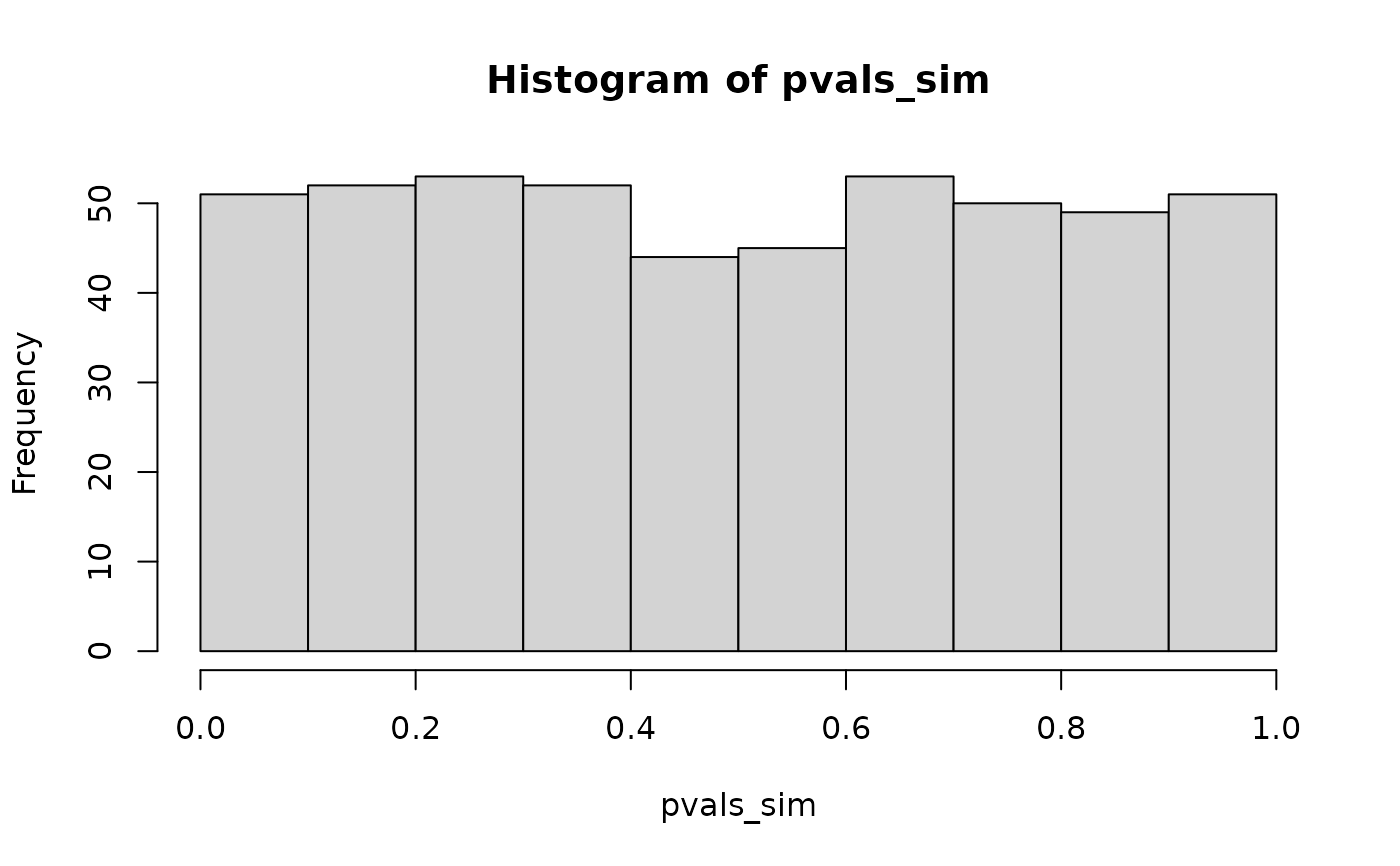
hist(pvals_sim) # well calibrated p-values are uniform under the null
 quantile(pvals_sim)
#> 0% 25% 50% 75% 100%
#> 1.646160e-06 2.270775e-01 4.901588e-01 7.458356e-01 9.998199e-01
quantile(pvals_sim)
#> 0% 25% 50% 75% 100%
#> 1.646160e-06 2.270775e-01 4.901588e-01 7.458356e-01 9.998199e-01