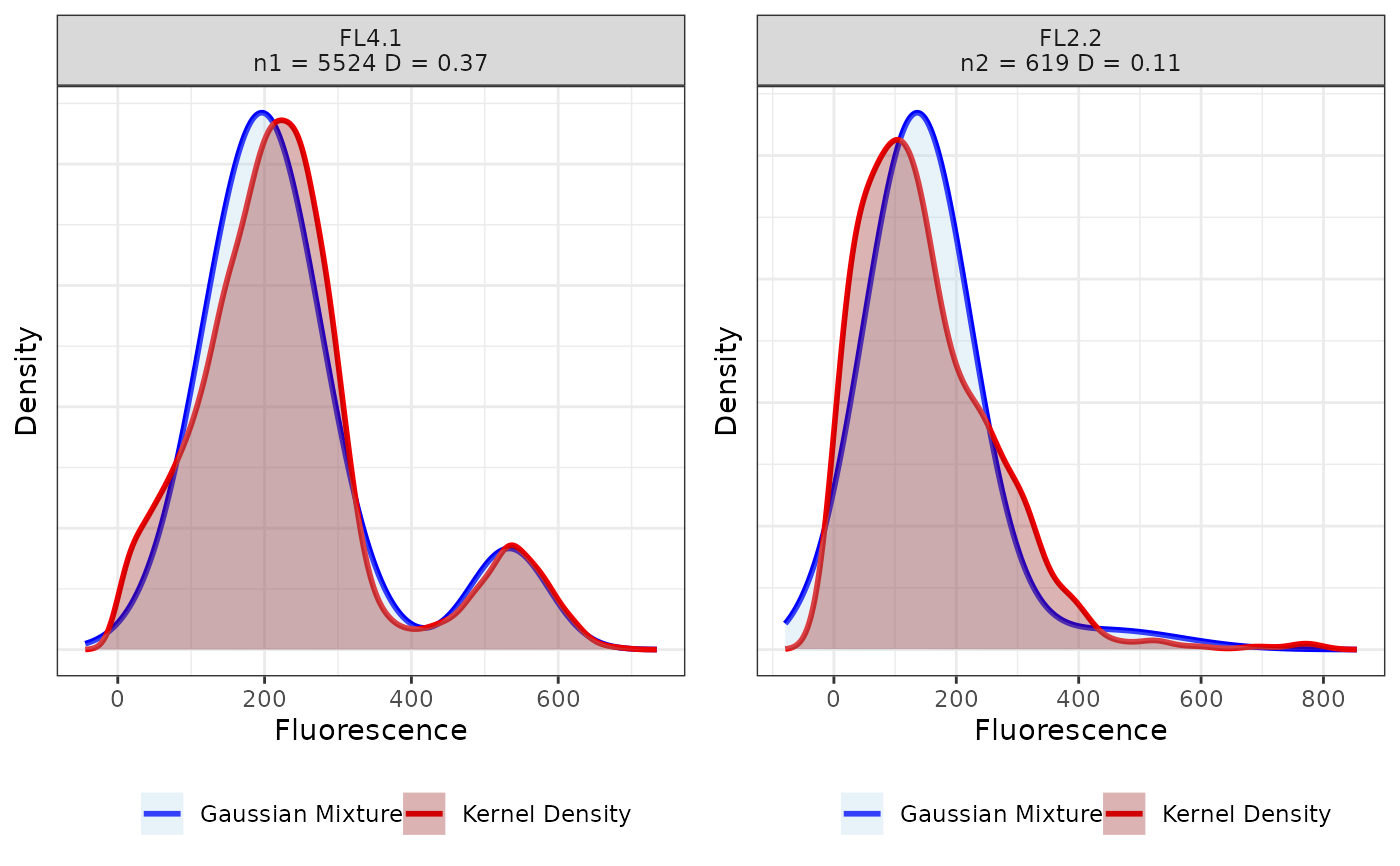
Plot the distribution of the observed cells at each node of the binary tree built using CytomeTree.
Source:R/plot_nodes.R
plot_nodes.RdPlot the distribution of the observed cells at each node of the binary tree built using CytomeTree.
Arguments
- CytomeTreeObj
An object of class CytomeTree.
- nodes
A list of character elements containing the name of the nodes for which the distribution is to be plotted. Default is
NULL, and plots the distribution for each node.- nodesPerCol
an integer specifying the number of plots to be displayed per column when plotting multiple nodes at once. Default is
NULL.- nodesPerRow
an integer specifying the number of plots to be displayed per row when plotting multiple nodes at once. Default is
NULL.- ...
further arguments to be passed to
plot_grid.
Details
if both nodesPerCol and nodesPerRow are NULL
then all the nodes are plotted on a single page.
"GM" stands for "Gaussian mixture" and "KDE" stands for
"Kernel Density Estimation".
Examples
data(DLBCL)
myct <- CytomeTree(DLBCL[, c("FL1", "FL2", "FL4")], minleaf = 1, t=.1)
#>
  |
  |                                                                      |   0%
  |
  |=======================                                               |  33%
  |
  |===============================================                       |  67%
  |
  |======================================================================| 100%
plot_nodes(myct)
